Single Cell Transcriptomics
Published:
Introduction
The non-linear and continuous features that are intrinsic to biological systems makes asking the right questions challenging. To avoid this challenge, one approach may be to perform a high throughput study. This involves profiling thousands of samples in the hope of a fortuitous biological discovery. One example, that has scaled massively since its inception in 2008 (Fig.1), is single cell transcriptomics (scRNAseq). This method has lead to the identification of new cellular sub-types (e.g. T-cell subsets in tumour microenvironments), some of which, are predicative of cancer prognosis’ and treatment response.
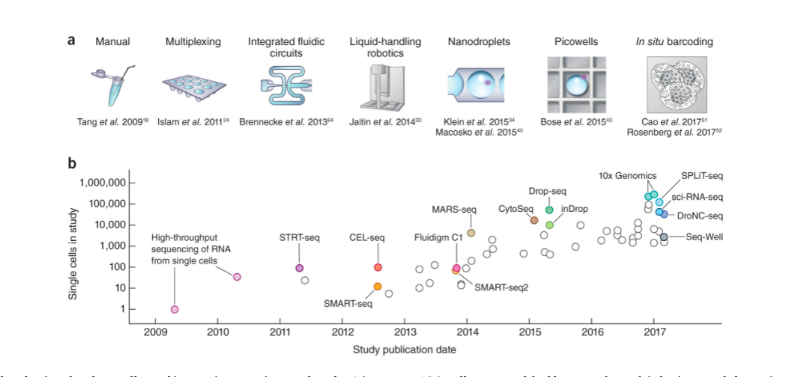
Fig.1. The increase in throughput of single cell transcriptomics studies has been exponential.
There are plenty medium articles explaining the ‘ideal data analysis workflow’ for scRNAseq, so I will refrain (for now) on contributing to an already over-populated resource. In the interim I will think about how to write (hopefully) high quality posts and how I can differentiate myself from others. After all, my posts are mainly for myself as a record (or ‘second-brain) for information that I struggled to retrieve from the internet or learned through experience. If these help others, then that is a plus. The following will include some key experimental principles behind scRNAseq and I hope it to have the correct level of detail so that it is comprehensible by a wide audience. The sole pre-requisite is knowledge about the properties of nucleic acids (Fig.2) and transcription (DNA -> RNA).
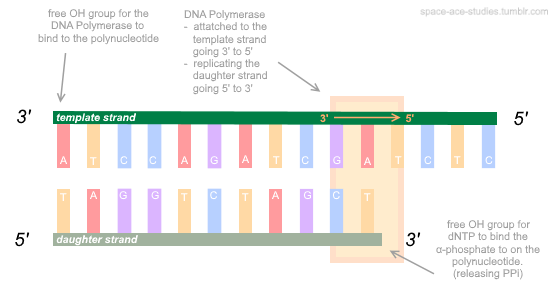
Fig.2. Nucleic acids are polar. The 3’ end terminates with a hydroxyl group (-OH) and the 5’ end terminates with a negatively charged phosphate (PO4-2). DNA is transcribed by RNA polymerase into mRNA transcripts. The instabiity of mRNA means that its quantification provides a good model for measuring gene expression.
Overview
- An experimental overview of scRNAseq focused on the QIAseq 3’ transcriptome kit.
- Cell lysis
- Reverse transcription (mRNA -> cdNA)
- Purification of cDNA
- Fragmentation, ‘end-repair’ and polA addition of cDNA
- Quality control (QC) of cDNA library before sequencing
- Illumina sequencing by synthesis chemistry
The rationale for single cell over bulk methods
Bulk methods are cheaper to peform and often carried out as a triage to single cell studies in order to provide a degree of hypothesis guidance. They involve lysing hundreds of thousands to millions of cells and reading out their transcriptome (in the case of RNAseq). This averaging destroys important information on cellular heterogeneity. For instance, scRNAseq can be used to measure changes in cell populations during an immune response (i.e. if your sample are immune cells) or capture transient changes in gene expression that may be indicative of ‘novel’ cell states (e.g. during cell differentiation). In my opinion, the holy grail of scRNAseq would be if it could be performed simultaneously with genomics, proteomics and metabolomics (i.e. to link DNA -> RNA -> protein -> metabolites) on the same sample over a time course, because this would greatly improve models of cell dynamics (Fig.3). An attractive option to expedite this would be the single Cellome system SS2000 by Yokogawa that enables automatic biopsies of single cells SS2000. A recent paper has optimised a similar method named LiveSeq. This method uses a micrometre lever that gently performs subcellular sampling in response to small forces. In a proof-of-concept study the authors were able to delineate transcriptional changes during the differentiation of macrophages by sampling picograms (10-12 g) of subcellular material over a time course. This is promising as one major caveat of scRNA is that the low amount of input material used (i.e. < 1 cell ) results in only the most abundant transcripts being detected (In general). Consequently, rare disease causing transcripts are almost impossible too identify.
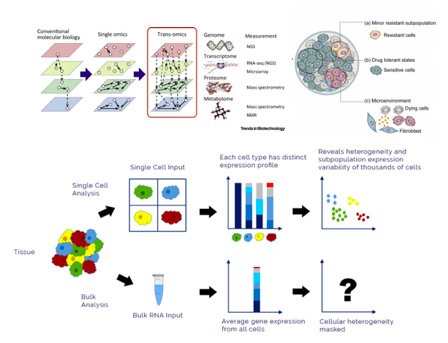
Fig.3. Upper; The combination of multiple omics techniques (genomics, transcriptomics, proteomics and metabolomics) allows the identification of non-linear relationships in cell dynamics, otherwise missed by a single technique. Lower; single cell transcriptomics preserves information about cellular heterogeneity. This information is lost using bulk methods because gene expression changes are averaged over thousands/millions of cells.
An experimental overview of single cell transcriptomics
Cell lysis
Cell lysis can be performed by numerous methods. The aim is to break down the phospholipid bilayer membrane that encapsulates the cell and release the subcellular material. In essence the membrane protectes the cell from its aqeuous environment because the two environments are immiscible. A detergent is both hydrophobic and hydrophillic so disrupts this separation by forming interactions with the membrane and the surrounding solution to destroy the protective lipid barrier. As we are interested in RNA we can also add an enzyme that degrades proteins e.g. proteinase K. Moreover, RNA is intrinsically unstable, because it is single stranded, and readily degraded by ubiquitious RNases. The recovery of mRNA from cell lysates is improved using RNAase inhibitors.
Reverse transcription of RNA to cDNA
Transcription is the process of converting DNA into RNA. Since we are monitoring the transcriptome, we need to perform reverse transcription (RNA → complementary DNA). Firstly, we need to capture the RNA. During the synthesis of mRNA from DNA a long stretch of adenine nucleotides (a poly-A tail) are added to one end of the newly synthesised RNA to increase its stability. Most protocols use this polyA tail to capture mRNA using a complementary oligo-dT (essentially a poly-T tail) which can base pair with the poly-A tail on the mRNA. This oligo-dT acts as a primer for the reverse transcription (RNA → cDNA) reaction (Fig.4). To catalyse the reaction using the oligo-dT as a starting point also requires an enzyme (reverse transcriptase) which extends the oligo-dT primer by joining contiguous DNA nucleotides that are complementary to the opposite strand. This synthesises the first strand of cDNA too form a cDNA-RNA duplex.
If we pause here to think about the rationale. We need to generate cDNA from the cells mRNA, but we cannot just sequence the cDNA generated in this step because there are too few copies of it. However, if we only use the one poly-T primer to amplify the cDNA for sequencing we would encounter issues with processivity i.e. the enzyme used for cDNA amplification would have a tendency to fall off the further away it goes from the poly-dT primer. Consequentely, the 5’ end (opposite end to the poly-A tail) of cDNA would become successively shorter. Therefore, we need to find a method to add a universal primer to the 3’ end in order too amplify the cDNA with high fidelity in later steps. The solution here is to use a special reverse transcriptase enzyme that adds a series of cytosine nucleotides when it reaches the end of the template. By also including a second primer (orange), called a template switching oligo, the reaction will proceed as follows: The poly-dT oligo will prime the synthesis of the first strand of cDNA by the special reverse transcriptase; the reverse transcriptase will add a stretch of cytosine nucleotides when it reaches the 5’ end of the mRNA (a property that is intrisic to its function); the template switching oligo (The second primer; orange) then binds this stretch of cytosines enabling the reverse transcriptase to continue its synthesis. The reaction is completed by a DNA polymerase that completes the 3’ synthesis of the top strand.
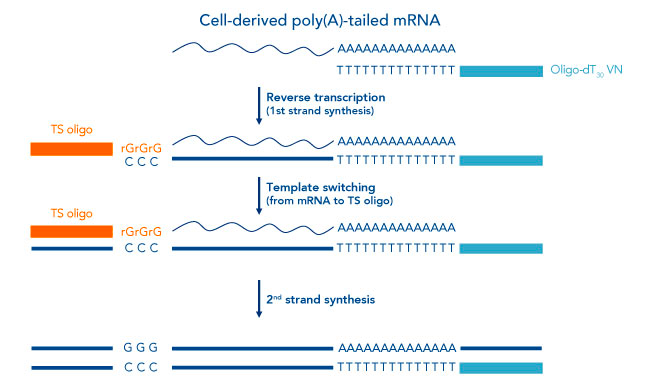
Fig.4. Reverse transcription using template switching.
The reverse transcription step has installed universal primers (poly-dT and the template switching oligo) at either end of every cDNA molecule so that it can be amplified further with high fidelity. For an additional layer of complexity the 5’ primer (orange) can also include a unique molecular identifier (UMI) and/or cell ID. These functionalise each RNA molecule with unique random stretch of nucleotides and specify a unique code per single cell. This is often necessary because the low input of RNA can exacerbate amplification biases from PCR e.g. biased amplification of longer mRNA transcripts.
For instance, say there is one copy of transcript X and two copies of transcript Y. PCR bias towards the shorter length of transcript Y results in its eight-fold (16 copies) amplification whilst transcript X is amplified by four-fold (4 copies). The absolute difference in transcript number is x2 but the relative difference, after amplification, is x4. These amplification biases can be reduced by tagging each RNA molecule with a UMI. In the analysis step, these UMIs can be reduced to the absolute number of original transcripts.
During this reaction we can also peform rRNA depletion by using special oligos that contain locked nucleic acids. These bind rRNA more tightly than the oligodT primer. Although this doesn’t strictly degrade rRNAs it prevents their amplification in subsequent steps.
cDNA clean-up
To increase the concentration of cDNA for sequencing and to remove impurities (e.g. primers, free dNTPs and salts from PCR reactions) we need to perform purification of our cDNA. Ethanol purification involving ‘beads’ is a common method. The beads are magnetic and the solution often contains a high concentration of salt and polyethylene glycol (PEG). Ethanol forms hydrogen bonds with the aqeuous solution (‘absorbing water’) and the positively charged salt ions (Na+) precipiate the negatively charged cDNA. PEG can add greater impetus to this reaction through its function as a ‘crowding agent’. PEG can crash the DNA out of solution and onto these beads which can be magnetically separated from the impurities in the solution.
This amplified and purified cDNA library is a pure solution generated from all the transcripts originally in the cell. This step is performed multiple times throughout the workflow (usually after PCR) to remove PCR reagents and buffers that would interfere with sequencing.
Fragmentation, ‘End-repair’ and A tailing
Illumina sequencing is a short-read sequencing technology that can only read short sequences of ~150 bp. To sequence our cDNA library we must use an enzyme to cut our library into small fragments that can be sequenced (Fig.5). As these endonuclease enzymes do not always cut cleanly to give straight ends, overhanging ends of the library are ‘evened out’ using a DNA polymerase. This fragmentation step means that our library can no longer be amplified using the previous primers. To circumvent this an dATP is added to the 3’ end of the library (A-tailing/poly-A addition). This can be performed by supplementing the reaction with dATP only and using a non-proof reading DNA polymerase. This adenine overhang functions as a primer for T-tailed adapters too be ligated onto our library. These adapters are common oligos that are required for our library to hybridise with the flow cell of Illumina sequencers. These are ligated onto the 5’ and 3’ end of the library so that the library can be sequenced in both directions. The inclusion of a sample index into the adapter oligo can also enable the multiplexing of many samples i.e. the combination of several cDNA libraries into a single reaction vessel for sequencing, rather than performing multiple individual runs.
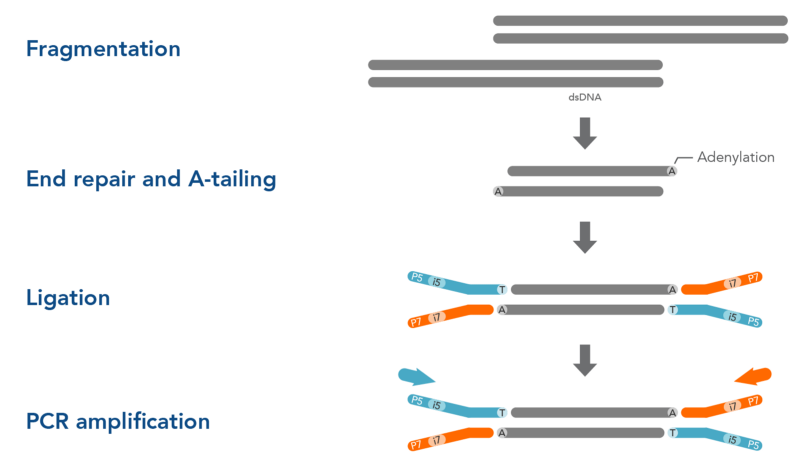
Fig.5.Fragmentation, End-repair and adapter ligation. Note that for ligation of adapters to occur the addition of adenine nucleotides at both ends is necessary.
Out of all the aforementioned steps this step is of the lowest fidelity. One of the most accurate methods to quantify the concentration of adapter ligated libraries is using qPCR and capillary gel electrophoresis (i.e. a Tapestation machine). The molarity of the cDNA library can be calculated using these methods and overamplification of the library also identified. For instance, limiting primers can result in your fragmented library re-annealling via their complementary ends to form ‘bubble-products’ (Fig.6).
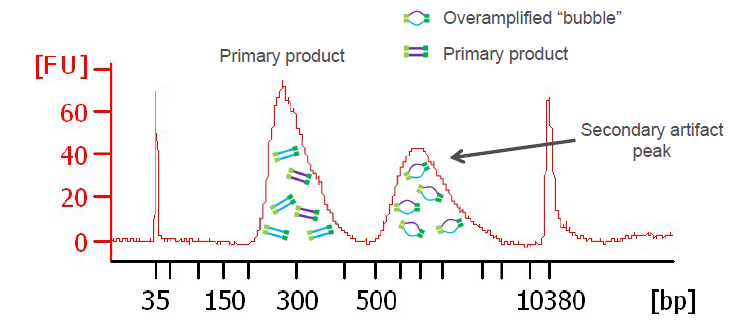
Fig.6. Capillary electrophoresis plot where PCR over-amplification has occurred. bp = base pair and FU = fluorescence units.
Sequencing
The overamplified double-stranded cDNA library is denatured using NaOH which breaks the hydrogen bonds that separate the strands. The library is then mixed with hybridisation buffer to enable the hybridisation of the library to the flow cell via complementary base pairing between the libraries adapter sequences and those adapters hybridised too the flow cell.
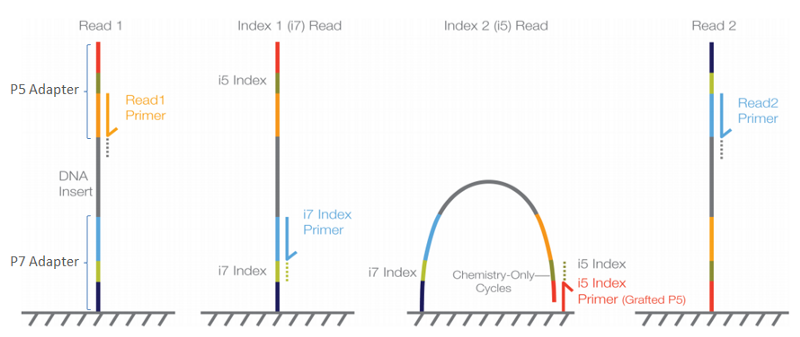
Fig.7. Sequencing by synthesis overview. Each strand binds to the flow cell via complementary base pairing between adapters. The bridge amplification step enables each strand to be sequenced twice (firstly via the read 1 primer and secondly via the read 2 primer)
Sequencing of single stranded DNA proceeds by sequencing by synthesis (Fig. 6). Individual fluorescent nucleotides complementary to the each strand are joined onto the read 1 primer whilst a camera takes an obsence number of images to quantify the bases added. The sample indexes are then sequenced using a different primer. This is followed by bridge amplification of the attached strand in order for the strand to be synthesised in the reverse direction using the read 2 primer.
Fig.8. Each base added in sequencing by synthesis is quantified by fluorescent detection. Each base is represented by a different colour
As this method relies on fluroescent detection, a low diversity library (e.g. the sequencing of an amplicon where the majority of seqeunces are identical) will result in lower quality base call scores. For instance, the sequencing of an amplicon where the majority of bases are identical would manifest in a single colour across the whole image, making it challenging to assign bases to reads. The two main solutions to this caveat involve adding a solution provided by Illumina called PhiX or to use a custom primer. In scRNAseq we want to assign as many reads as possible to our library rather than PhiX because we have such a low input of material. A custom primer that binds to a commons sequence of the lbrary, e.g. the universal primers ligated onto our reads, peforms the same function as PhiX because read 1 does not begin within a common sequence. Moreover, such custom primers are often shorter than those normally used and so free up slightly more reads for our library.
Thanks for reading my first post, please share this post if you found it useful. If there are any areas you would like me to elaborate on please let me know. The next post I have planned is on high throughput image analysis. I hope this is clear to understand — if it isn’t then please reach out.
Main References
[1] Svensson, V., Vento-Tormo & R. & Teichmann, S., 2018. Exponential scaling of single-cell. RNA-seq in the past decade.. Nat Protoc, Volume 13, pp. 599–604.
[2] LC Sciences, 2020. LC Sciences. [Online]. Available at: https://www.lcsciences.com/discovery/applications/transcriptomics/single-cellrna-seq-sequencing-service/
[3] Altschuler, S. J. & Wu, L. F., 2010. Cellular heterogeneity: do differences make a difference?. Cell, 141(4), pp. 559–63.
[4] Hwang, B., Lee, J. & Bang, D., 2018. Author Correction: Single-cell RNA sequencing technologies and bioinformatics pipelines.. Experimental & Molecular Medicine, 53(1005), pp. 50–96.
[5] Yugi K, K. H. H. A. K. S., 2016. Trans-Omics: How To Reconstruct Biochemical Networks Across Multiple ‘Omic’ Layers. Trends Biotechnol, 12(13), pp. 276–290.